
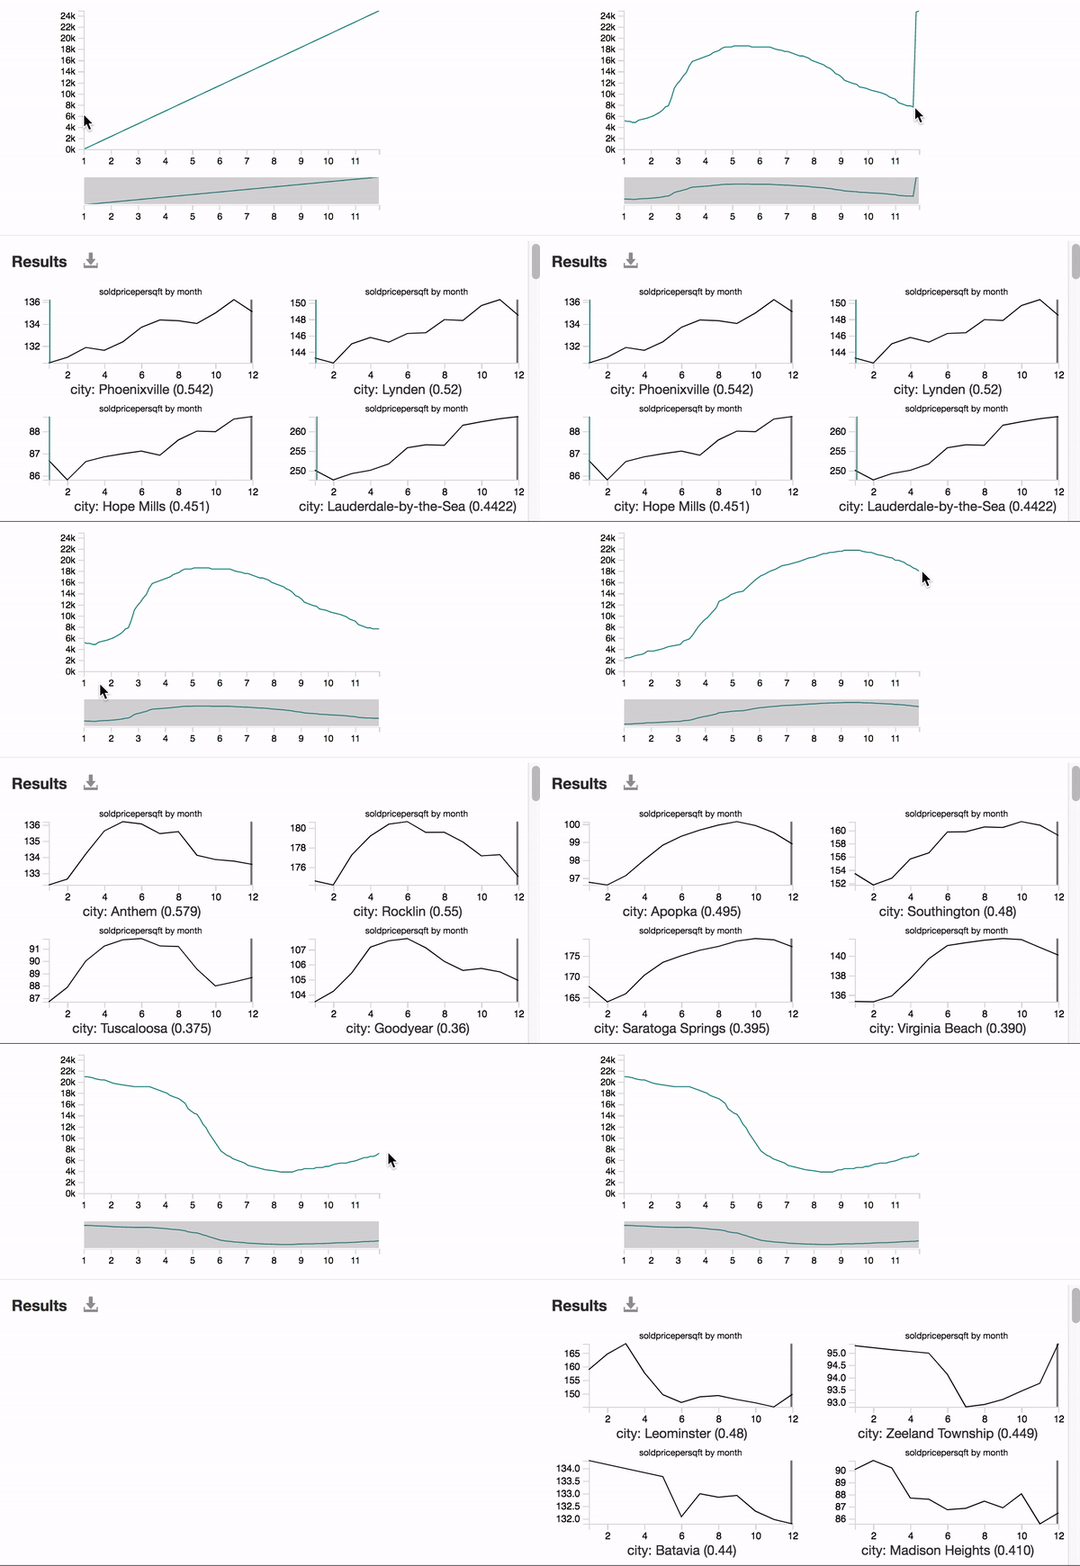
In Zenvisage, you can look for visualizations of interest by sketching the desired pattern on the querying canvas. For example, searching for cities with housing prices that rises at the beginning of the year then drops in the later part of the year.
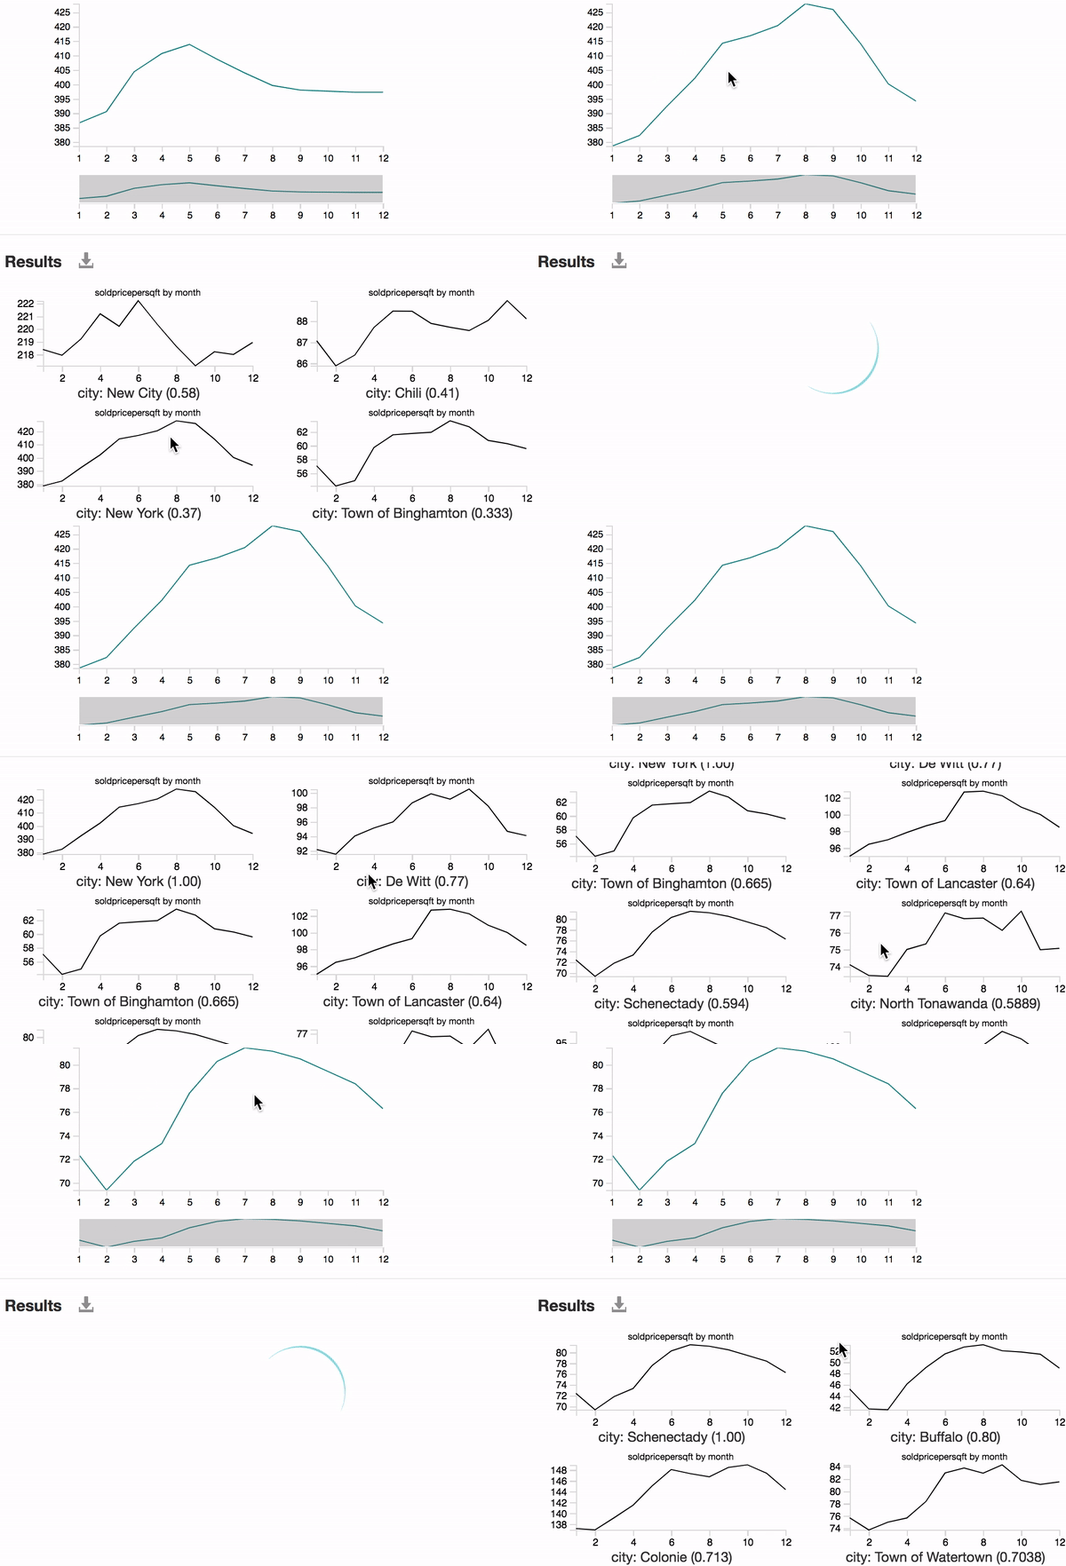
You can also search for visualizations by dragging and dropping a visualization into the query canvas. For example, you can look for other cities that have a similar housing pattern to New York City.
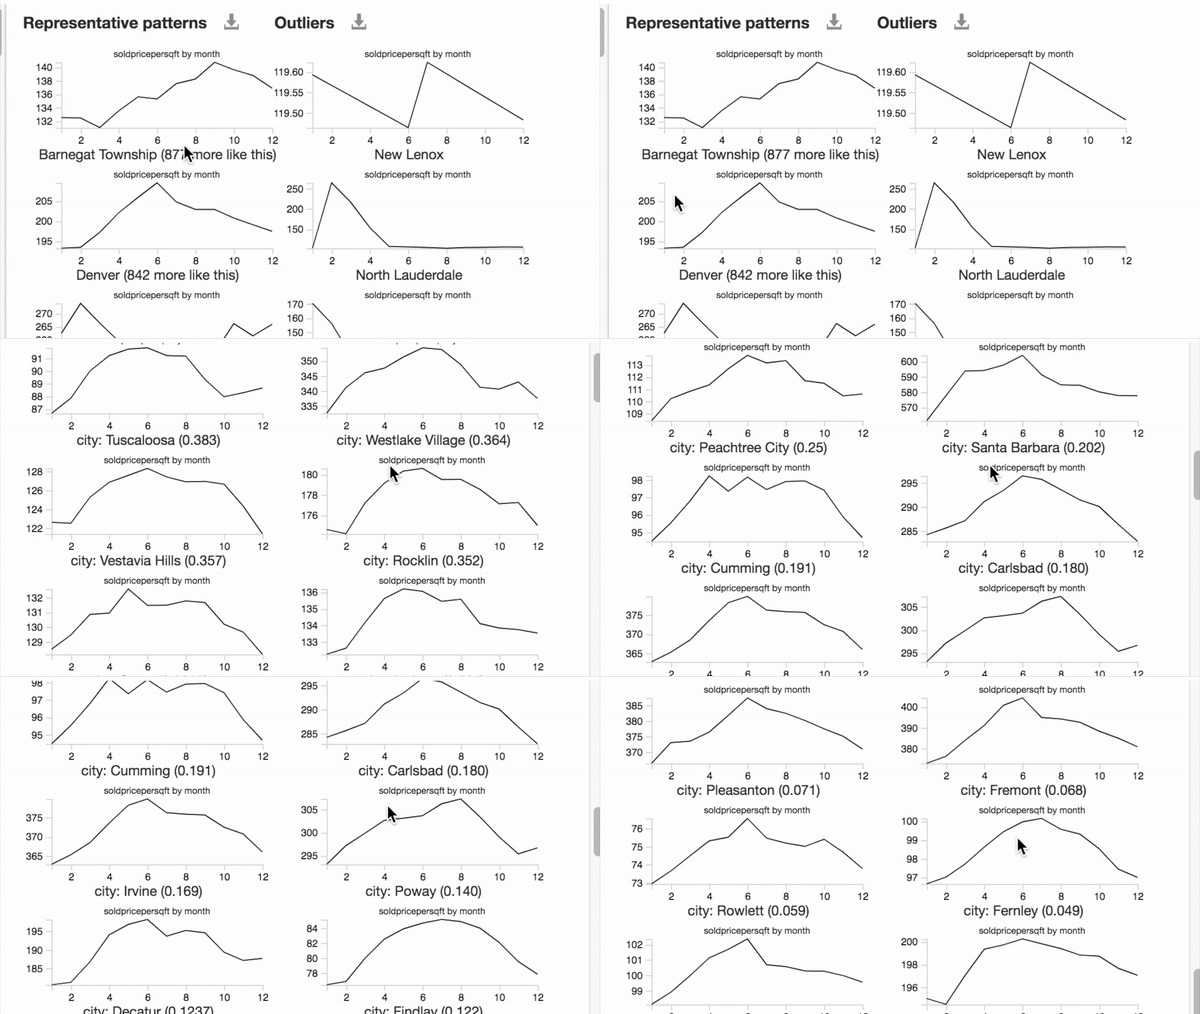
Given a queried pattern, Zenvisage displays a ranked list of visualizations based on how similar the visualization is to the queried pattern. We also recommend representative trends and outliers to highlight the different types of patterns in the dataset.
Material Science Battery Discovery
Using dynamic classes, scientists can compare characteristics from different data classes to find a solvent datapoint that satisfies desirable properties, such as high-voltage or low solubility. By browsing through patterns in different data classes, they can also study the overall tradeoffs and relationships between data attributes.
Astronomical Transient Discovery
By sketching a peak-then-decay pattern on the query canvas, astronomers can directly search for potential supernovae candidates. Using interactive filtering, they can also eliminate sources of data anomaly to improve match accuracy for finding candidates.
Gene Expression Analysis
Using the recommended representative trends in Zenvisage, geneticists can learn about the characteristic pattern profiles in their dataset. They can also search and browse for genes belonging to the same representative cluster via drag-and-drop.
This demo introduces functionalities from our latest software release (v3.0) for Zenvisage, including different ways for constructing visual queries to search for patterns of interest, as well as additional features, such as interactive data filtering, dynamic class creation, data smoothing.
Try out our live demo !© Zenvisage 2019. With generous funding from Google, Siebel Energy Institute, and Toyota.